Orlando Housing Market Snapshot – June 2016
Median Price
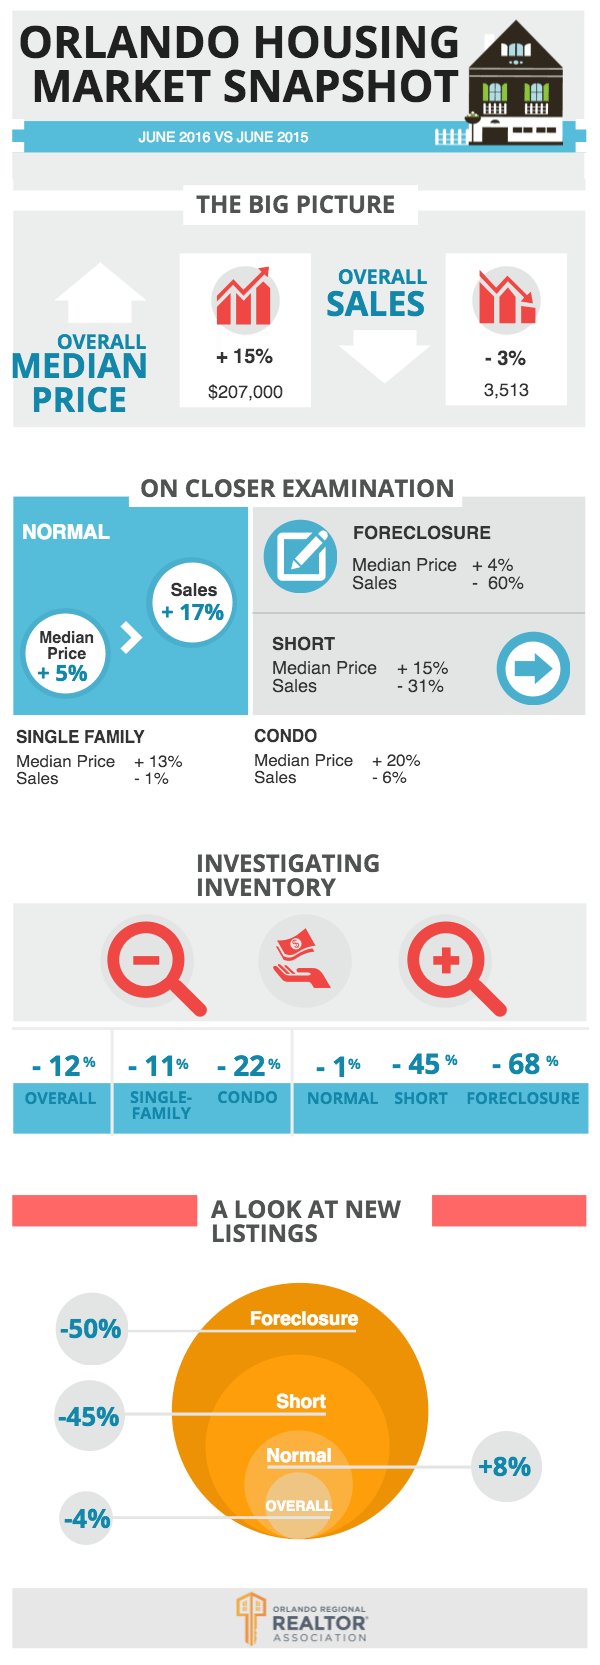
*The median price of all existing homes combined sold in June 2016 — $207,000 — is a 15.00 percent increase from the $180,000 median price recorded in June 2015, and a 1.97 percent increase compared to May 2016.
*The median price for “normal” existing homes sold in June is $215,000, an increase of 4.88 percent from the median price of “normal” existing homes in June 2015.
*The year-over-year median price for short sales
increased by 14.54 percent in June while the median price for bank-owned sales increased by 3.54 percent.
*The year-over-year median price for single-family homes increased by 12.50 percent, and the year-over-year median price for condos increased 19.76 percent.
Sales
*Orlando home sales (all home types and all sales types combined) in June 2016 were down 2.50 percent when compared to June of 2015 and up 4.96 percent compared to May 2016.
*Single-family sales decreased 0.88 percent year over year, while condo sales decreased by 5.67 percent.
*Of the 3,513 sales in June, 3,092 normal sales accounted for 88.02 percent of all sales, while 321 bank-owned and 100 short sales respectively made up 9.14 percent and 2.85 percent.
*The number of normal sales in June increased by 16.50 percent compared to June 2015, while foreclosures decreased 60.12 percent and short-sales decreased 30.56 percent.
*The 5,512 pendings in June of this year are a decrease of 20.07 percent compared to the 6,896 pendings in June of last year (and a 9.27 percent decrease compared to the 6,075 pendings last month).
*Short sales made up 15.48 percent of pendings in June, a decline of 41.93 percent from June of last year. Normal properties accounted for 72.48 percent (an increase of 4.50 percent) of sales, and bank-owned properties accounted for 12.05 percent (a decrease of 58.60 percent).
*Sales of existing homes within the entire Orlando MSA (Lake, Orange, Osceola, and Seminole counties) in June (4,192) were down by 3.41 percent when compared to June of 2015 (4,340). To date, sales in the MSA are down 0.24 percent.
Each individual county’s monthly sales comparisons are as follows:
- Lake: 1.44 percent above June 2015;
- Orange: 3.09 percent below June 2015;
- Osceola: 12.32 percent below June 2015; and
- Seminole: 0.55 percent below June 2015.
Inventory
*There are currently 10,629 homes available for purchase through the MLS. The June 2016 overall inventory level is 11.85 percent lower than it was in June 2015; inventory is up 0.72 percent compared to May 2016.
*The inventory of normal sales decreased 1.11 percent compared to June 2015, while foreclosure inventory is down 67.62 percent and short sale inventory is down 44.68 percent.
*Year-over-year single-family home inventory is down 10.26 percent; condo inventory is down 21.80 percent.
*The current pace of sales translates into 3.03 months of inventory supply.
Other
*New contracts are down 12.49 percent compared to June of 2015. New listings are down 3.71 percent.
*The Orlando affordability index increased to 161.30 percent in June. First-time homebuyer affordability in June increased to 114.70 percent.
*Homes of all types spent an average of 62 days on the market (down from 67 the month prior) before coming under contract in June 2016, and the average home sold for 96.93 percent of its listing price (down from 97.16) percent the month prior.


